ELK Part 1: Setting Up Elasticsearch & Kibana
Build your own log management and analytics system with the Elastic Stack. This detailed guide walks through installing and configuring Elasticsearch and Kibana on Ubuntu 24.04, covering hardware requirements, security setup, and verification steps for a fully functional deployment in your homelab environment.
Overview
There are several options for Security Information Management (SIM) and Security Information and Event Management (SIEM) solutions, but the Elastic Stack (ELK) is one of the most popular.
TL;DR
In this guide, I'll cover how to set up Elasticsearch and Kibana on Ubuntu 24.04 for a homelab environment. I'll walk through installing both components, configuring security settings, and verifying your installation is working properly. I'll also cover hardware requirements, authentication handling, and setting up the foundational components for a complete log management system. This is part one of a series that will help you build your own SIEM solution using the Elastic Stack.
What is ELK?


The Elastic Stack is a collection of three open-source project:
- Elasticsearch - which is a distributed, RESTful search and analytics engine capable of hanlding large volumes of data. The core features are: distributed search, multi-tenancy, real-time search, and analytics.
- Logstash - which is a server-side data processing pipeline that ingests data from multiple sources simultaneously, transforms it, and then sends it to a "stash" like Elasticsearch. For example, on Linux systems with
syslogand other logs in/var/log, Logstash can be configured to collect and parse these logs and bring them into Elasticsearch. - Kibana - which is a data visualization dashboard for Elasticsearch. It provides visualization capabilities on top of the content indexed on an Elasticsearch cluster. Similar to Grafana, Kibana allows you to explore large volumes of data interactively and in real-time. You might choose Kibana over Grafana if you are already using the Elastic Stack for log aggregation and processing.
that are used together for log aggregation, log processing, and data visualization. In this series, we will be setting up the Elastic Stack on a single server to collect and visualize logs from various sources.
Setting Up Elasticsearch
One of the first things to consider is the infrastructure and scale of the deployment that you need. For a small homelab or test environment, you can run all three components on a single server. For a production environment, you would want to run Elasticsearch on a cluster of servers to provide redundancy and scalability.
But also, do you run these products natively on a VM, as a docker-compose or a Kubernetes deployment? For this series, we will be running the Elastic Stack natively on a single Ubuntu 24.04 server.
Even for a modest homelab environment, this will be processing a heavy amount of data, regularly. So, below is a table of recommended CPU, RAM, and disk space, just as a starting point:
| Component | CPU | RAM | Disk |
|---|---|---|---|
| Elasticsearch | 4 cores | 8 GB | 100 GB |
| Logstash | 2 cores | 4 GB | 50 GB |
| Kibana | 1 core | 2 GB | 10 GB |
If you are going to run this on a single server in your homelab then you will need:
| Component | CPU | RAM | Disk |
|---|---|---|---|
| Elasticsearch + Logstash + Kibana | 8 cores | 16 GB | 160 GB |
If you are going to run this on a cluster of servers then you can divide the resources accordingly.
Installing Prerequisites
Before we can install Elasticsearch, we need to install the Java Development Kit (JDK). Elasticsearch requires Java 8 or later.
To install the latest version you can run the following commands:
1
2
sudo apt update
sudo apt install -y openjdk-17-jdk
You can verify the installation by checking the version of Java:
1
java -version
You should see output similar to the following:
1
2
3
openjdk version "17.0.13" 2024-10-15
OpenJDK Runtime Environment (build 17.0.13+11-Ubuntu-2ubuntu124.04)
OpenJDK 64-Bit Server VM (build 17.0.13+11-Ubuntu-2ubuntu124.04, mixed mode, sharing)
Installing Elasticsearch
Elasticsearch is not available in the default Ubuntu repositories, so we will need to download and install it manually. You can download the latest version of Elasticsearch from the official Elasticsearch website.
To download the latest version of Elasticsearch to the /tmp folder, you can use wget:
1
2
3
4
5
6
7
8
# Switch to the /tmp directory
cd /tmp

# Download the latest version of Elasticsearch
wget https://artifacts.elastic.co/downloads/elasticsearch/elasticsearch-8.17.0-amd64.deb

# Download the SHA512 checksum file
wget https://artifacts.elastic.co/downloads/elasticsearch/elasticsearch-8.17.0-amd64.deb.sha512
The SHA512 checksum is the same filename except with .sha512 appended to it. You can verify the checksum of the downloaded file using the following command, and then visually compare the output to the checksum file:
1
2
3
sha512sum -c elasticsearch-8.17.0-amd64.deb.sha512 \
    && echo -e '\e[32m✅ Hashes match!\e[0m' \
    || echo -e '\e[31m❌ Hashes do not match!\e[0m'
This will either output ❌ Hashes do not match! or ✅ Hashes match!, meaning that the file is either corrupted or not. If the hashes match, you can install Elasticsearch using apt:
Once downloaded and verified, you can install Elasticsearch using apt:
1
2
# Install Elasticsearch
sudo apt install ./elasticsearch-8.17.0-amd64.deb
Note in the output of that installation, as it has some key details that you will need later:
1
2
3
4
5
6
7
8
9
10
11
12
13
14
15
16
17
18
19
20
21
22
23
24
25
26
27
28
--------------------------- Security autoconfiguration information ------------------------------

Authentication and authorization are enabled.
TLS for the transport and HTTP layers is enabled and configured.

The generated password for the elastic built-in superuser is : <YOUR 20 CHARACTER PASSWORD>

If this node should join an existing cluster, you can reconfigure this with
'/usr/share/elasticsearch/bin/elasticsearch-reconfigure-node --enrollment-token <token-here>'
after creating an enrollment token on your existing cluster.

You can complete the following actions at any time:

Reset the password of the elastic built-in superuser with
'/usr/share/elasticsearch/bin/elasticsearch-reset-password -u elastic'.

Generate an enrollment token for Kibana instances with
 '/usr/share/elasticsearch/bin/elasticsearch-create-enrollment-token -s kibana'.

Generate an enrollment token for Elasticsearch nodes with
'/usr/share/elasticsearch/bin/elasticsearch-create-enrollment-token -s node'.

-------------------------------------------------------------------------------------------------
### NOT starting on installation, please execute the following statements to configure elasticsearch service to start automatically using systemd
 sudo systemctl daemon-reload
 sudo systemctl enable elasticsearch.service
### You can start elasticsearch service by executing
 sudo systemctl start elasticsearch.service
Therefore, before going on, you should enable and start the Elasticsearch service:
1
2
3
4
5
6
7
8
# Reload the systemd daemon
sudo systemctl daemon-reload

# Enable the Elasticsearch service (so that it starts upon boot)
sudo systemctl enable elasticsearch.service

# Start the Elasticsearch service
sudo systemctl start elasticsearch.service
You can verify that Elasticsearch is running by checking the status:
1
sudo systemctl status elasticsearch.service
Also, if you sudo apt install net-tools, you can see that Elasticsearch is listening on port 9200:
1
netstat -tuln | grep 9200
You should see output similar to the following:
1
tcp6       0      0 :::9200                 :::*                    LISTEN
At this point you have successfully installed and started Elasticsearch. In the next part of this series, we will install and configure Logstash.
Lastly, since Elasticsearch is basically an API, you can verify that too by navigating to https://<your-server-ip>:9200 in your browser. You will see a basic-auth prompt. Use elastic as the username and the password that was generated during the installation.
You should see a JSON response similar to the following:
1
2
3
4
5
6
7
8
9
10
11
12
13
14
15
16
17
{
  "name" : "elk",
  "cluster_name" : "elasticsearch",
  "cluster_uuid" : "Bp7zhulrTPm4HODBPzG1OA",
  "version" : {
    "number" : "8.17.0",
    "build_flavor" : "default",
    "build_type" : "deb",
    "build_hash" : "2b6a7fed44faa321997703718f07ee0420804b41",
    "build_date" : "2024-12-11T12:08:05.663969764Z",
    "build_snapshot" : false,
    "lucene_version" : "9.12.0",
    "minimum_wire_compatibility_version" : "7.17.0",
    "minimum_index_compatibility_version" : "7.0.0"
  },
  "tagline" : "You Know, for Search"
}
Now that Elasticsearch is up and running, you can move on to installing Kibana.
Setting up Kibana
Kibana is a data visualization dashboard for Elasticsearch. It provides visualization capabilities on top of the content indexed on an Elasticsearch cluster. Similar to Grafana, Kibana allows you to explore large volumes of data interactively and in real-time.
Installing Pre-requisites
Before we can install Kibana, we need to install the Java Development Kit (JDK). Kibana requires Java 8 or later. If you are running this on the same server, this should already be installed. If not, you can install it using the commands from above.
In addition to the JDK, Kibana also requires Elasticsearch to be running. If you haven't already, you can install and start Elasticsearch using the commands from above.
Installing Kibana
Kibana is not available in the default Ubuntu repositories, so we will need to download and install it manually. You can download the latest version of Kibana from the official Kibana website.
To download the latest version of Kibana to the /tmp folder, you can use wget:
1
2
3
4
5
6
7
8
# Switch to the /tmp directory
cd /tmp

# Download the latest version of Kibana
wget https://artifacts.elastic.co/downloads/kibana/kibana-8.17.0-amd64.deb

# Download the SHA512 checksum file
wget https://artifacts.elastic.co/downloads/kibana/kibana-8.17.0-amd64.deb.sha512
The SHA512 checksum is the same filename except with .sha512 appended to it. You can verify the checksum of the downloaded file using the following command, and then visually compare the output to the checksum file:
1
2
3
sha512sum -c kibana-8.17.0-amd64.deb.sha512 \
    && echo -e '\e[32m✅ Hashes match!\e[0m' \
    || echo -e '\e[31m❌ Hashes do not match!\e[0m'
This will either output ❌ Hashes do not match! or ✅ Hashes match!. If the hashes match, you can install Kibana using apt:
1
2
# Install Kibana
sudo apt install ./kibana-8.17.0-amd64.deb
Similar to Elasticsearch, the service is installed, but not Enabled or Started. You can enable and start the service with the following commands:
1
2
3
4
5
6
7
8
# Reload the systemd daemon
sudo systemctl daemon-reload

# Enable the Kibana service (so that it starts upon boot)
sudo systemctl enable kibana.service

# Start the Kibana service
sudo systemctl start kibana.service
You can verify that Kibana is running by checking the status:
1
sudo systemctl status kibana.service
Also, if you sudo apt install net-tools, you can see that Kibana is listening on port 5601:
1
netstat -tuln | grep 5601
You should see output similar to the following:
1
tcp        0      0 127.0.0.1:5601          0.0.0.0:*               LISTEN      1671/node
You might notice that port :5601 is bound to the localhost, or 127.0.0.1 IP address. This is because Kibana is configured to only listen on the localhost by default. If you want to access Kibana from another machine, you will need to configure Kibana to listen on all interfaces. To do that, you will need to edit the Kibana configuration file:
1
sudo nano /etc/kibana/kibana.yml
In that file, you will need to find the server.host setting and change it to server.host: "0.0.0.0". Save and close the file, and then restart the Kibana service:
1
sudo systemctl restart kibana.service
When you run netstat -tupln | grep 5601 again, you should see that Kibana is now listening on all interfaces:
1
tcp        0      0 0.0.0.0:5601            0.0.0.0:*               LISTEN      1719/node
Now, you should be able to access Kibana by navigating to http://<your-server-ip>:5601 in your browser. You should see the Kibana initialization page. There is a prompt to "Configure Elastic to get started" where you can "Paste enrollment token". You might remember in the Elasticsearch installation, there was a command to generate an enrollment token for Kibana instances. You can run that command now:
1
/usr/share/elasticsearch/bin/elasticsearch-create-enrollment-token -s kibana
Put in that code and you will see a prompt like this:
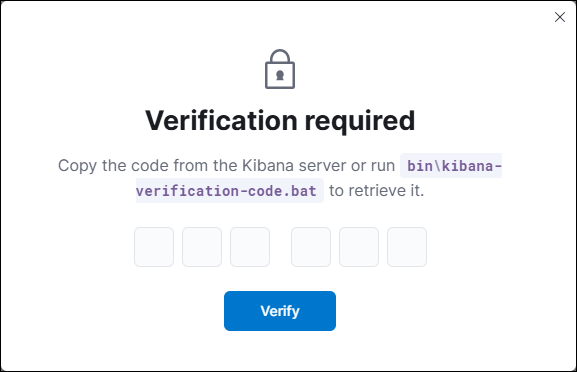
That reference isn't quite right. On my Ubuntu 24.04 machine, that script is really:
1
/usr/share/kibana/bin/kibana-verification-code
The output of that is something like:
1
Your verification code is:  104 398
Finally, at that URL of http://<your-server-ip>:5601, you should see the Kibana login page. Use elastic as the username and the password that was generated during the Elasticsearch installation:
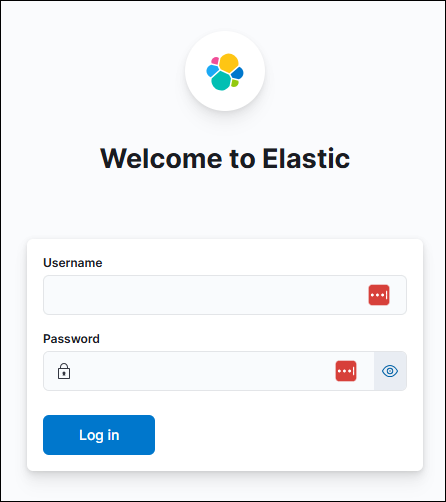
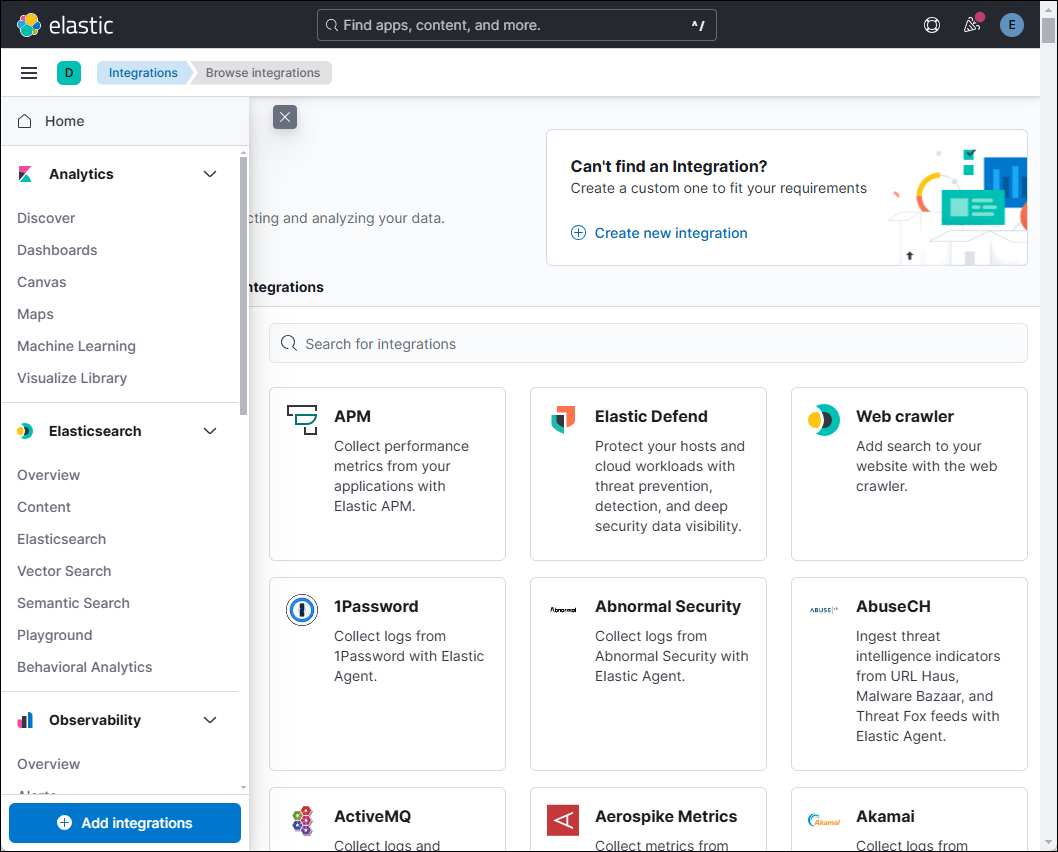
You should now be able to access Kibana and start visualizing your data.
Summary
At this point, the Elasticsearch API is up and running and Kibana is installed and running. You can navigate to the Kibana front-end by visiting http://<your-server-ip>:5601 in your browser. That should look something like this: